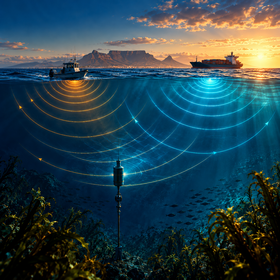
Underwater Vessel Noise Challenge by the French Embassy in South Africa
For this challenge, you will work with real acoustic measurements from ten monitoring sites along South Africa’s coast. These data provide an opportunity to explore the local underwater soundscape and develop or adapt your models to South African recording conditions.
South African training data:
1,715,779 real, unlabelled acoustic records from ten sites, generally at one-minute resolution. These are frequency-band summaries, not audio recordings. There is no supplied vessel-label column or labelled Train.csv.
South_African_Real_Acoustics.zip contains one Parquet file per site in the acoustics/ directory, together with station metadata, recorder metadata and a data dictionary. Each acoustic table includes site/recorder identifiers, export timestamps (t), observed duration in seconds (dur), TOL_<frequency> band levels and basic quality flags. Recorder band coverage varies; quality flags are screening aids, not a guarantee of usable measurements.
Supporting files:
- stations.csv gives working coordinates and uncertainty notes
- recorders.csv gives recorder coverage; DATA_DICTIONARY.md explains the fields and known limitations.
Some additional notes:
- If you obtain AIS data separately, check its timestamp convention against the acoustic export clock before joining the datasets.
- Coordinates are approximate. If you use external AIS, its coverage may be incomplete and a single observation may be linked to more than one site.
- The absence of AIS data does not prove a vessel was absent, and proximity to a hydrophone does not prove it was audible.
Synthetic test data:
The test uses real South African background measurements with controlled additions derived from recorded vessel passages. Knowing the added energy lets us define a target even though the original measurements are unlabelled. Some windows have no added passage reference, and other acoustic activity can also be present. A zero target means no controlled addition; it does not mean the original background is vessel-free.
A passage reference may include ambient sound from its original recording. Its known added energy is therefore not isolated vessel-only energy. The test includes references from smaller craft and larger ships; vessel identity, count, type and size are not scored targets.
You receive 1,500 test examples in Test.csv. Each example represents a 15-minute observation window with measurements in 25 frequency bands. One CSV row contains its ID and all 375 acoustic values (15 minute positions × 25 bands). These are summaries of acoustic measurements, not raw audio samples.
The 25 bands are logarithmically spaced third-octave bands on a base-10 (deci-decade) grid. Their centre frequencies run from approximately 31.6 Hz to 7.94 kHz. These are band centres, not the outer edges of the frequency range.
Sound levels are expressed in decibels (dB), using the convention of the original exports. Absolute pressure calibration has not been independently verified. Decibels are logarithmic: adding two dB values does not give the combined sound energy. Missing observations are blank cells in Test.csv and will normally load as NaN. A finite value is observed; a blank cell is missing and must not be treated as silence. No separate validity-mask file is required.
All test examples are supplied together in a random order, identified only by ID. You are not told which examples belong to public or private evaluation. Test windows do not include station locations, observation timestamps or AIS tracks, and the original backgrounds before the additions are not provided. The background periods used for the test are excluded from the training release.
Test files:
- Test.csv contains all 1,500 test windows. Its columns are ID followed by 375 acoustic features, ordered by minute position and then frequency. For example, m01_TOL_31.6 is the band centred at 31.6 Hz at minute position 1. Band centres and minute positions are encoded in the column names; minute positions are relative to the window, not observation timestamps.
- SampleSubmission.csv contains all 1,500 test IDs and the required columns: ID, share_added_vessel and score_added_vessel. Prediction values are placeholders, not answers.
- maritime_starter_notebook.ipynb shows how to load the CSV files, recover the 15-minute × 25-band layout and create a valid constant-baseline submission. It also includes source attribution and licence notices.
Learning approach:
Participants may learn from released real South African measurements and permitted public corpora, using labelled external examples where available, self-supervised methods, carefully qualified AIS supervision, or their own augmentations. No particular method is required.
You may use public acoustic data from Ocean Networks Canada (ONC) and Croatia's HearMyShip, subject to the competition's external-data rules. These datasets are not included in the download package; obtain them directly from their providers.
If you use external audio recordings, convert them to the one-minute frequency-band representation expected by the test inputs. Explain how you handle measurement units, time alignment and missing observations, so others can reproduce your work.
External source links:
Join the largest network for
data scientists and AI builders